BSc Computer Science Final-Year Project
Design and Evaluation of a Container-based Malware Execution & Analysis Environment
- Author
- Máté Gergely Saáry
- Institution
- Department of Computer Science, University College Cork
- Supervisor
- Prof. John P. Morrison
- Date
- · 71 min read
Contents
Abstract
Malspect is a container-based malware analysis sandbox that executes untrusted binaries in an isolated environment, and produces behavioural risk assessments from syscall-level telemetry. The project investigates whether containerisation, combined with a user-space kernel, can provide a viable alternative to traditional VM sandboxes for lightweight dynamic analysis.
The system uses Podman with gVisor (runsc) as the container runtime. gVisor intercepts every syscall in the user space, providing both strengthened isolation and complete observability without exposing the host kernel to malware. Captured syscall traces are parsed and evaluated by a rule-based heuristics engine that maps observed behaviours to the MITRE ATT&CK framework, assigns severity tiers based on kill-chain position, and computes a composite risk score classifying samples as benign, suspicious, or malicious.
Acknowledgements
I would like to express my sincere gratitude to my supervisor, Professor John P. Morrison, for his invaluable guidance, challenging of my perspectives, and encouraging broader thinking.
Abbreviations
| Abbreviation | Meaning |
|---|---|
| AJAX | Asynchronous JavaScript and XML |
| API | Application Programming Interface |
| CLI | Command Line Interface |
| CRUD | Create, Read, Update, Delete |
| CSS | Cascading Style Sheets |
| CVE | Common Vulnerabilities and Exposures |
| DOM | Document Object Model |
| eBPF | extended Berkeley Packet Filter |
| ELF | Executable and Linkable Format |
| GID | Group Identifier |
| HTML | HyperText Markup Language |
| HTMX | HTML over the Wire |
| HTTP | HyperText Transfer Protocol |
| JSON | JavaScript Object Notation |
| LLM | Large Language Model |
| MD5 | Message Digest 5 |
| NIST | National Institute of Standards and Technology |
| OCI | Open Container Initiative |
| PCAP | Packet Capture |
| PE | Portable Executable |
| PID | Process Identifier |
| QEMU | Quick Emulator |
| REST | Representational State Transfer |
| SDK | Software Development Kit |
| SHA | Secure Hash Algorithm |
| SPA | Single Page Application |
| SQL | Structured Query Language |
| SSH | Secure Shell |
| TID | Thread Identifier |
| UID | User Identifier |
| VM | Virtual Machine |
| WAL | Write-Ahead Logging (SQLite feature) |
1 Introduction
1.1 Motivation
Malware analysis; the process of examining malicious software to understand its behaviour and intent, is a critical aspect of modern cybersecurity. Experts typically execute suspicious programs in isolated environments known as sandboxes, where the program’s actions can be observed with minimised risk to the host system. The dominant approach uses virtual machines to provide this isolation, but virtualisation is resource-intensive and increasingly susceptible to detection by malware designed to recognise virtualised environments (and thus evade analysis).
Containers offer a lightweight alternative. They isolate applications using operating system mechanisms, rather than emulating entire hardware stacks, and are consequently faster to start, cheaper to run, and less susceptible to traditional anti-virtualisation techniques used by evasive malware (Section 2.2). However, contain-ers come with their own downsides. They share the host system’s kernel, which presents a weaker isolation boundary than a virtual machine’s hypervisor. This tradeoff; better performance and stealth at the cost of weaker isolation, has limited the adoption of containers for malware analysis.
This project investigates whether supplementary isolation mechanisms can help narrow this gap sufficiently to make container-based malware analysis viable.
1.2 Project Goals
The goal of this project is to design and implement a secure, container-based sandbox capable of executing untrusted samples in isolation, capturing their runtime behaviour, and automatically classifying this behaviour as benign, suspicious, or malicious. The system should expose its functionality through a programmatic interface, and provide an optional web dashboard permitting submission of samples and interactive inspection of their results.
1.3 Approach
The system uses gVisor, an open-source application kernel developed by Google, as both the isolation mechanism and the telemetry source. gVisor intercepts every system call (low level operations a program requests from the operating system), and handles them in user-space, preventing the analysed program from ever reaching the host kernel. As a side effect of this interception, gVisor logs all system call activity, providing comprehensive behavioural telemetry without requiring any external monitoring tools.
This telemetry is then processed by a set of rule-based heuristic detectors, each aligned with a tactic from the MITRE ATT&CK framework, a publicly accessible knowledge base of adversary tactics and techniques based on real-world observations of cyberattacks. The detectors produce a weighted risk score that classifies the sample automatically. The system is implemented in Go, uses Podman as the container runtime, and provides a command-line interface, a REST API, and a web dashboard for submitting samples and reviewing results.
1.4 Summary of Achievements
The completed system produces deterministic, reproducible analysis results of user-supplied samples. The analysis pipeline completes in milliseconds, and most samples finish execution within under a second. All requirements established in the analysis phase are met. Directions for future work, including testing against real-world malware, are discussed in Chapter 6.
2 Analysis
This chapter examines the objectives, requirements, and any background context necessary to understand the design decisions described in subsequent chapters.
2.1 Objectives
The aim of this project is to design and implement a secure, container-based sandbox environment capable of executing untrusted code (malware) snippets in isolation, capturing behavioural telemetry through syscall interception, and classifying observed behaviour against an established adversary taxonomy. The system should:
-
Provide a reproducible, hardened execution environment for executing potentially malicious code.
-
Capture syscall-level telemetry during execution, and;
-
Use the telemetry to classify the observed behaviour against rule-based heuristic detectors, producing a risk score that categorises the sample as benign, suspicious, or malicious.
-
Expose all functionality through a REST API, with an optional web dashboard for sample submission and visual inspection of results.
The project will assess the feasibility of container-based isolation, and its sufficiency for lightweight malware analysis. The project additionally aims to evaluate the adequacy of using monitoring to produce a concise profile of malware samples.
2.2 Problem Context
Containers have rapidly become the de facto standard for application deployment, due to their lightweight, portable performance, and natural integration with modern cloud infrastructure [6]. In the context of security and malware analysis, containers prove an attractive alternative to hypervisor-based virtual machines: they share the host’s physical hardware and are therefore less susceptible to the anti-virtualisation fingerprinting techniques that are used by modern malware to detect and evade analysis environments [12].
Such anti-virtualisation techniques are well-documented. The MITRE ATT&CK framework catalogues them under Virtualisation/Sandbox Evasion (T1497), which encompasses system checks for virtualisation artifacts, user activity-based checks, and timing-based evasion [15]. Chen et al. present a taxonomy of these techniques, grouping them by the system abstraction they target: hardware artifacts (e.g. virtualised network adapters with identifiable vendor prefixes, or emulator-specific device strings), execution environment anomalies (e.g. relocated processor descriptor tables or debugger-injected memory markers), the presence of installed monitoring applications, and behavioural discrepancies such as timing deviations caused by instruction virtualisation [4]. Their empirical analysis of 6,900 malware samples found that more than 40% reduced their malicious behaviour when executed under a virtual machine or with a debugger attached. Containers avoid the hardware and execution environment categories of this taxonomy, as they execute directly on the host’s hardware and kernel with no hypervisor layer to fingerprint.
That said, containers introduce their own detection artifacts. Khalimov et al. found that while Docker containers are a promising sandboxing option, they come “at the cost of new detection artifacts which make containers subject to fingerprinting through different sources that malware can easily find” [12]. User-space kernels such as gVisor introduce further artifacts: Schmatloch [19] empirically tested nine detection vectors and found that gVisor is reliably detectable from within, for example through unimplemented syscalls that return ENOSYS where a native Linux kernel would succeed, or through gVisor’s synthetic dmesg output generated from a hardcoded message list. gVisor was not designed for transparency; its security model prioritises isolation over stealth [24].
Despite this reduced fingerprinting surface, dynamic malware analysis remains dominated by virtual machine-based sandboxes [12]. The reason is that virtual machines provide a stronger isolation boundary through the hypervisor. In comparison, containers share the host operating system kernel, meaning that a kernel vulnerability could be exploited by a malware sample to escape the container and affect the host system.
This project aims to investigate whether supplementary isolation mechanisms, layered on top of standard container controls, can narrow this gap sufficiently to make container-based analysis viable. The system does not claim to be undetectable; a sufficiently sophisticated sample could identify the gVisor environment and alter its behaviour accordingly. This limitation is shared by all existing analysis platforms, including VM-based sandboxes, which are similarly detectable [4].
2.3 Background & Related Work
This section presents the background material and existing research relevant to the design and implementation of this project.
2.3.1 Malware Analysis
Malware analysis is the “process of determining the purpose and functionality of a given malware sample” [3], to understand its behaviour, capabilities, and origin. Two broad approaches are used: Static analysis examines a sample without executing it, through techniques such as signature matching, disassembly, and entropy measurement [13], while dynamic analysis executes the sample in a controlled environment, and attempts to observe its runtime behaviour, overcoming the limitations of static analysis against obfuscated or packed binaries [5].
Safe dynamic analysis requires an isolated environment, commonly referred to as a “sandbox”. Sikorski and Honig define a sandbox as a “security mechanism for running untrusted programs in a safe environment without fear of harming real systems” [21]. Egele et al. survey the landscape of dynamic analysis tools and identify three categories of execution environments: analysis in User- or Kernel-space, in an emulator, or a virtual machine [5]. Container-based approaches represent a more recent line of investigation.
More recent work has begun to explore containers as a lightweight alternative. Khalimov et al. investigate the use of container-based environments for malware analysis, finding that containers offer improved transparency over hypervisor-based sandboxes but introduce new detection artifacts that malware can exploit for fingerprinting [12]. Von der Assen et al. present SecBox, a container-based sandbox using Docker and gVisor that collects syscall telemetry, network traffic, and performance metrics during execution [2]. These contributions validate the container-based approach but, as discussed in Section 2.3.4, differ from the present work in scope and automation.
2.3.2 Container Isolation and Security
Containers are a form of operating system-level virtualisation combined with application software packaging [22]. They isolate applications using two Linux kernel mechanisms: namespaces and control groups.
Namespaces wrap global system resources in an abstraction that makes it appear to processes within the namespace that they have their own isolated instance of each resource [11]. The Linux kernel provides eight namespace types, isolating resources such as process IDs, network stacks, mount points, and user identities [11]. A container typically operates within a dedicated instance of each namespace, thus preventing its processes from observing or affecting processes outside the container.
Control groups (cgroups) complement namespaces by enforcing resource limits, helping to prevent resource exhaustion of the host from a single container [22]. Additional mechanisms such as Linux capabilities and seccomp profiles further reduce the attack surface by decomposing root privileges into individually grantable units and restricting the set of syscalls a process may invoke, respectively.
The fundamental limitation of this model is that all containers on a host share the host operating system kernel. Unlike a VM, a containerised process issues syscalls directly to the host kernel. As NIST notes, “the use of a shared kernel invariably results in a larger inter-object attack surface than seen with hypervisors” [22]. This shared-kernel weakness motivates the use of supplementary isolation mechanisms such as user-space kernels, which are discussed in the following subsection.
2.3.3 gVisor
gVisor is an open-source application kernel that provides workload isolation by intercepting syscalls and handling them in user-space [24]. Unlike the namespace-based isolation described in the previous subsection, gVisor interposes a component called the Sentry, between the workload and the host. The Sentry contains a from-scratch reimplementation of the Linux syscall interface, written in memory-safe Go. As such, it services all syscalls made by the sandboxed process without passing any of them to the host kernel.
The other property of gVisor that is particularly relevant to this project is observability. Because the Sentry intercepts every syscall, gVisor can log all syscall activity via a built-in strace mode, enabled through the --strace flag [25]. This provides comprehensive syscall-level telemetry, including arguments, return values, and timing, all without needing any external monitoring tools. The system described in this report makes use of this capability as its sole telemetry source, as detailed in Section 4.4.
2.3.4 Related Work
The dominant approach to dynamic malware analysis is the use of virtual machine-based sandboxes. CAPE [17] is an actively maintained open-source platform forked from the now-defunct Cuckoo sandbox. It executes samples inside VM guests monitored by in-guest agents that hook API calls, capturing file operations, network traffic, and process activity. CAPE extends its predecessor with automated malware configuration extraction and dynamic unpacking of protected payloads. SaMOSA [26] is a more recent Linux-focused sandbox that uses QEMU full-system emulation. SaMOSA is designed as a data collection framework and does not perform any automated classification. Commercial platforms such as ANY.RUN offer cloud-hosted VM analysis with interactive sessions. These systems benefit from the strong isolation guarantees of the hypervisor boundary, but they share the operational overhead inherent to virtualisation and are susceptible to the anti-VM fingerprinting techniques described in Section 2.2.
The most directly comparable work is SecBox, a container-based dynamic mal-ware analysis platform presented by von der Assen et al. [2]. SecBox shares a similar architectural foundation with the present work: both use gVisor as a sandbox run-time within Linux containers and capture syscall-level telemetry during execution. However, the two systems differ in purpose and scope. SecBox is designed mainly as a data collection platform, providing interactive analysis sessions and exporting labelled datasets for downstream machine learning pipelines. Table 1 summarises the key differences.
Table 1: Comparison of SecBox and Malspect.
| Aspect | SecBox | Malspect |
|---|---|---|
| Classification | Manual; no automated detection or scoring. | Automated; seven heuristic detectors with risk scoring. |
| Taxonomy | No ATT&CK mapping. | Detectors mapped to ATT&CK tactics and techniques. |
| Static analysis | None. | SHA-256 hashing, entropy measurement, ELF metadata extraction. |
| Network policy | Outbound connectivity permitted. | All network access disabled; connection attempts logged. |
| Evaluation | Two case studies (manual). | Benchmark suite with automated validation. |
| Interactive analysis | Live shell access during execution. | Batch-only; no runtime interaction. |
| Telemetry breadth | Syscalls, PCAP, CPU/memory/disk metrics. | Syscalls only. |
Malspect extends the container-based sandbox paradigm established by SecBox by adding automated behavioural classification. Where SecBox collects data for later analysis, Malspect processes telemetry at the point of capture, producing actionable assessments without need for manual intervention. This comes at the cost of SecBox’s broader telemetry coverage and interactive analysis capabilities, which suit exploratory-style research workflows.
2.4 Requirements Analysis
This section declares the functional and non-functional requirements of the system to be developed. Each requirement is mapped to the section in which it is addressed.
2.4.1 Functional Requirements
The functional requirements are derived from the analysis pipeline established by the project objectives. The pipeline consists of three phases: ingestion and execution (FR1, FR4), telemetry capture and isolation enforcement (FR2, FR3), and analysis and reporting (FR5, FR6). Each requirement addresses a distinct capability that must be present for the pipeline to function as a whole.
Table 2: Functional requirements.
| ID | Requirement | Reference |
|---|---|---|
| FR1 | Accept a user-supplied binary and run it within a dedicated container. | Section 3.2 |
| FR2 | Enforce strict isolation between the host and container, preventing container escape. | Section 3.2 |
| FR3 | Detailed, meaningful syscall-level telemetry data must be collected, including file operations, process creation and network activity. | Section 4.4 |
| FR4 | Automatically create, configure, execute, and destroy containers programmatically. | Section 4.3.1 |
| FR5 | Provide an exposed API for submitting samples and retrieving telemetry results. | Section 3.5 |
| FR6 | Generate a concise report summarising the behaviour of the executed sample. | Section 4.3.1 |
2.4.2 Non-Functional Requirements
The non-functional requirements arise from the operational context of executing adversarial code. Security (NFR1) is paramount given that the system processes untrusted inputs by design. Performance (NFR2) ensures the system remains practical for iterative analysis workflows. Extensibility (NFR3) and graceful error handling (NFR4) support the system’s use where both the analysis pipeline and sample set could evolve over time. Usability (NFR5) acknowledges that the system serves both programmatic clients (via the API), and human operators (via the CLI and web interface).
Table 3: Non-functional requirements.
| ID | Requirement | Reference |
|---|---|---|
| NFR1 | Untrusted code must not compromise the host system. | Section 3.2 |
| NFR2 | Overhead introduced by containerisation and telemetry collection should be minimised. | Section 3.2.3 |
| NFR3 | The architecture should be extensible, supporting integration into automated workflows and future extension to multi-instance deployments. | Section 4.9.1 |
| NFR4 | Execution failures and timeouts should be handled gracefully, with appropriate error handling. | Section 4.3 |
| NFR5 | The system should be as user-friendly as possible, with clear, intuitive interfaces for both CLI and API usage. | Section 3.5 |
2.5 Summary
This section established the objectives and requirements of the project, and presented relevant background material necessary to understand the design decisions described in subsequent chapters. The project is motivated by the observation that containers offer advantages in performance and transparency over virtual machines for malware analysis, but are limited by their shared-kernel isolation model. gVisor was introduced as a supplementary isolation mechanism that aims to address this weakness. A comparison with existing work, including the VM-based CAPE platform, the Linux-focused SaMOSA sandbox, and the container-based SecBox, positions Malspect’s contribution in combining hardened container isolation with automated behavioural classification and risk scoring.
3 Design
This chapter describes the high-level architectural design of the proposed system.
3.1 System Architecture
Malspect is designed as a modular system, with distinct separation of concerns between components. The architecture follows an API-driven approach, where all analysis functionality is exposed through a RESTful interface, allowing for both programmatic (CLI) and web-based interaction. Figure 1 illustrates the high-level component architecture.
3.1.1 Component Responsibilities
Command-Line Interface. The CLI serves as the primary interface for local operation and server management. It is the sole entry-point to the host-side binary, providing commands for local sample analysis (run local), API server lifecycle (serve), and database maintenance (db clean).
API Server. The API server manages the job lifecycle, by exposing RESTful endpoints for sample submission, job status querying, and report retrieval. It follows an API-first philosophy, where all functionality is accessible programmatically. It delegates execution to the Executor component (Section 3.1.1), and persists job state through the Store interface. The API server exposes a JSON API for programmatic clients, and optionally, a set of HTML fragment endpoints for consumption by the web interface.
Job Store. The Job Store provides an abstraction layer for persistence through a defined interface. This enables modularity of storage backends, allowing substitution without modifying existing code. The rationale for this interface-based design and the choice of storage backend are discussed in Section 3.6.
Executor. The Executor component is responsible for coordinating the full analysis pipeline for each job. It performs pre-execution static analysis on the host, constructs and manages a hardened container with gVisor as the OCI runtime, and orchestrates post-execution telemetry parsing and report generation.
Telemetry and Heuristics Engine. The telemetry component is responsible for parsing gVisor’s strace logs into structured events, and passing them to the behavioural analysis engine, which applies heuristic detectors aligned with MITRE ATT&CK tactics to classify observed behaviours and thus compute a risk score. The design of the telemetry and analysis subsystems is described in Sections 3.3.1 and 3.4.
3.1.2 Data Flow
Figure 2 illustrates the interaction between components during a typical analysis job. The workflow proceeds as follows:
-
A sample is submitted via the CLI or REST API, thus creating a new job entry in the Store with status
pending. The API returns a job identifier. -
The Executor performs static analysis on the host, then creates a hardened Podman container with the sample copied to the container’s working directory.
-
The container executes the sample with a timeout. gVisor’s Sentry intercepts all syscalls and writes strace logs to a host-accessible directory.
-
Upon completion or timeout, execution artifacts are extracted from the container’s output volume, and the container and its volumes are deleted.
-
The telemetry parser structures the raw strace logs into structured events. The heuristics engine analyses these events, producing behavioural indicators and a risk score.
-
A final report is generated containing static analysis results, execution logs, telemetry summary, and behavioural analysis results. The job status is updated to
completed.
3.1.3 Key Abstractions
Two interface abstractions define the key extension points in the architecture: The Store interface decouples the API and executor from any specific storage back-end, following the Dependency Inversion Principle [14]. This enables the system to operate with either in-memory storage (e.g. for development and testing) or persistent storage, and furthermore allows for future migration to a database supporting multi-instance deployments (such as PostgreSQL); all without modifying existing code. The JobExecutor interface similarly abstracts the container orchestration layer behind a single method, allowing the current Podman-based executor to be replaced with a Kubernetes-based implementation for cloud deployment.
3.2 Sandbox Design
The sandbox is responsible for executing potentially malicious samples in a controlled, isolated environment. Its design follows a defence-in-depth strategy, in which multiple independent security controls provide layered protection [16]. No single control is relied upon in isolation; a failure in any one layer aims to be contained and mitigated by the others. Figure 3 illustrates this layered model, showing three nested boundaries between the host OS and the untrusted sample.
3.2.1 Container Runtime
Podman is used as the container runtime. Its daemonless architecture is a direct security advantage: each container runs as a child process of the invoking command rather than being managed by a long-running daemon process, thus eliminating the daemon as a potential attack vector. Podman also supports rootless operation by default, and is designed with security-sensitive workloads as a primary concern, making it well suited to the execution of untrusted code. Its CLI is compatible with Docker, so established container workflows transfer seamlessly.
3.2.2 Container Hardening
Each analysis container is constructed with hardening measures applied at creation time. These are summarised in Table 4.
Table 4: Container hardening measures applied to each analysis container.
| Control | Effect |
|---|---|
| Read-only root filesystem | Prevents persistent modification of the container’s base filesystem. Writable storage is provided only through explicitly mounted volumes and tmpfs. |
| All capabilities dropped | Removes all Linux capabilities, preventing operations such as raw socket creation, module loading, and system administration calls. |
| No-new-privileges | Prevents privilege escalation via setuid or setgid binaries within the container. |
| No network access | The container has no network interfaces, blocking all inbound and outbound traffic. Attempted connections are still logged by gVisor for behavioural analysis. |
| Memory: 256 MB, CPU: 0.5 cores, PIDs: 64 | Prevents resource exhaustion attacks such as fork bombs or memory-based denial of service. |
| tmpfs at /tmp with noexec | Provides a size-limited scratch area that prevents execution of dropped binaries. |
| Non-root container user | The container image defines a dedicated user with no login shell. Processes run without root privileges inside the container. |
SELinux labelling is disabled for gVisor compatibility, as gVisor does not support SELinux security contexts. This is acceptable as gVisor’s syscall interception provides a stronger isolation boundary than SELinux; the sample’s syscalls never reach the host kernel regardless of SELinux labelling.
3.2.3 gVisor as Sandbox Runtime
Each analysis container runs under gVisor (Section 2.3.3). This provides two benefits: firstly, it establishes a stronger isolation boundary than namespace-based containers alone, as the attack surface is reduced to the Sentry rather than the host kernel. Secondly, gVisor’s built-in strace logging captures all syscalls made, returning arguments, values, and timing, all without needing any external monitoring tools. The telemetry design built on this capability is described in Section 3.3.1.
3.2.4 Container Storage
The container’s filesystem is partitioned into four mount points with distinct persistence and security characteristics, as shown in Table 5.
Table 5: Container mount points and their storage characteristics.
| Path | Type | Access | Purpose |
|---|---|---|---|
| / | Image layer | Read-only | Base filesystem containing the shell interpreter and network utilities. |
| /input | Bind mount | Read-only | Contains the submitted sample, mounted from the host. |
| /work | Named volume | Read-write | Working directory for sample execution. |
| /output | Named volume | Read-write | Execution artifacts written by the in-container runner for post-execution extraction. |
| /tmp | tmpfs | Read-write, noexec | Scratch space. In-memory, size-limited, execution of binaries prevented. |
Named volumes are used for /work and /output rather than tmpfs mounts. This is necessary because artifacts must be extracted from the container after it terminates: tmpfs contents are lost when the container stops, whereas named volumes persist independently of the container’s lifecycle.
3.2.5 Container Image Design
The container image is based on Alpine Linux, and further includes a shell interpreter, GNU coreutils, and network utilities (curl, wget). This represents a deliberate trade-off between attack surface minimisation and sample compatibility.
An earlier iteration of the design used a distroless base image to maximise attack surface reduction, however this prevented execution of shell script malware and generally reduced sample compatibility. Additionally, with the usage of gVisor, the isolation boundary can be considered as the syscall interception by Sentry, as opposed to the container’s filesystem.
The inclusion of network utilities serves a specific analytical purpose: when a sample invokes curl or wget, gVisor logs the resulting connect action with the target address. Although the connection fails (as the container has no network access), the attempt can be logged for behavioural analysis.
3.3 Telemetry Design
The telemetry subsystem captures and structures the syscall-level activity of each executed sample.
3.3.1 gVisor Strace as Telemetry Source
As described in Section 3.2.3, gVisor’s Sentry intercepts every syscall made by the containerised process. Enabling gVisor’s built-in strace logging causes the Sentry to write plaintext strace logs for each syscall invocation (see Listing 2 for format details).
This approach has several advantages:
-
The telemetry source acts as an isolation layer itself. There is no need to rely on a separate monitoring tool, and thus to install, configure, and secure it.
-
Full telemetry coverage. Given that gVisor’s Sentry intercepts all syscalls, it can be expected that all syscall activity is captured.
-
No risk of tampering. The logs are written to a host-accessible directory outside the container’s filesystem, meaning that the sample is unable to modify or delete any telemetry data.
The principal disadvantage is that gVisor’s strace output is produced in plaintext rather than a structured format such as JSON. This necessitates a dedicated parser to extract fields from each log line for later analysis. This implementation concern is discussed in-depth in Section 4.4.
It should be noted that though gVisor does offer a “--debug-log-format=json” option, this only modifies the format of the log lines, and does not provide any structure to the log lines themselves.
3.4 Behavioural Analysis Design
The behavioural analysis engine classifies the runtime activities of a sample by examining the events produced by the telemetry subsystem (Section 3.3.1). This section describes the detection methodology, its alignment with an established adversary taxonomy, and the risk scoring model used to produce a comprehensive risk assessment.
3.4.1 Detection Approach
Malspect uses rule-based behavioural heuristics: each detector defines syscall patterns indicative of a specific adversarial behaviour, and produces evidence items for each match. This approach is grounded in the work of Forrest et al. [7], who demonstrated that short sequences of system calls provide a stable behavioural signature for Unix processes, enabling detection of anomalous execution. The specific behaviour categories targeted by the detectors, process spawning, persistence via cron or init, privilege escalation, and network communication attempts, reflect well-established patterns of malware functionality [21], and are mapped to the corresponding MITRE ATT&CK tactics as described in Section 3.4.2.
Rule-based detection was chosen over anomaly-based or machine-learning approaches for two reasons: it produces explainable results with specific evidence for each finding, and it does not require a baseline of normal behaviour, which is impractical when trying to analyse previously unseen samples. The detection architecture follows the model established by Cuckoo Sandbox and CAPE [17], which use severity-tiered behavioural signatures.
3.4.2 MITRE ATT&CK Alignment
Each detector is mapped to a tactic and one or more techniques from the MITRE ATT&CK framework [15]. Severity is assigned based on the tactic’s position in the attack lifecycle, following the Cyber Kill Chain model [10]: later-stage activities are deemed more severe than earlier ones [28]. Table 6 summarises the mapping.
Table 6: Detector-to-ATT&CK tactic and technique mapping.
| # | Detector | Tactic | Sev. | Techniques |
|---|---|---|---|---|
| 1 | Execution | TA0002 | 2 | T1059 |
| 2 | Persistence | TA0003 | 3 | T1053, T1543, T1546 |
| 3 | Privilege Escalation | TA0004 | 3 | T1548 |
| 4 | Defence Evasion | TA0005 | 2 | T1070 |
| 5 | Discovery | TA0007 | 1 | T1082, T1083, T1552 |
| 6 | Command & Control | TA0011 | 3 | T1071, T1095 |
| 7 | File Dropper | TA0002 | 2 | T1059, T1569 |
Several ATT&CK tactics are intentionally omitted: tactics such as Initial Access (TA0001), Credential Access (TA0006), and Lateral Movement (TA0008) are non-applicable to the single-container sandbox environment. Tactics such as Impact (TA0040), Collection (TA0009), and Exfiltration (TA0010) represent potential future extensions (Section 4.9.2).
3.4.3 Risk Scoring Model
Each triggered detector contributes a weighted score determined by two dimensions: severity and confidence. The aggregate score is calculated as follows:
risk_score = min( 100, Σ severity_base[sev_i] × confidence_mult[conf_i] )
             where i ranges over the triggered detectors
Table 7: Severity base points by kill chain stage.
| Tier | Base Points | Kill Chain Stage |
|---|---|---|
| 1 - Informational | 10 | Early-stage |
| 2 - Suspicious | 20 | Mid-stage |
| 3 - Malicious | 30 | Late-stage |
Table 8: Confidence multipliers by evidence count.
| Evidence Count | Confidence | Multiplier |
|---|---|---|
| ⩾3 | High | 1.0 |
| 1-2 | Medium | 0.7 |
| 0 | Low | 0.4* |
* This row is inert; it never contributes to the score in practice (0 × 0.4 = 0). It is retained in the implementation to serve as an additional tier for weight adjustment.
Only detectors producing at least one evidence item contribute to the score. The score is capped at 100, and samples are classified as follows: Benign (0-20), Suspicious (21-50), or Malicious (51-100).
Worked example. A sample triggers Execution (severity 2, two evidence items), Command & Control (severity 3, one item), and Discovery (severity 1, four items):
(20 × 0.7) + (30 × 0.7) + (10 × 1.0) = 14 + 21 + 10 = 45 ⇒ SuspiciousThe severity and confidence values are manually-assigned rather than empirically derived, consistent with standard practice; both Cuckoo and CAPE use severity levels set manually.
3.5 API and Web Interface Design
The system exposes its functionality through a REST API, with an optional web dashboard layered on top. This section describes the rationale behind the API structure and the choice of web interface technology.
3.5.1 REST API Design
The API follows a resource-oriented design, versioned under /api/v1/ as per best practices for REST versioning [9]. Sample submission is asynchronous: the server accepts the upload, creates a job record, and returns a HTTP 202 with the job ID. The client then polls for completion. This is needed as the analysis takes an unknown amount of time to complete; a synchronous design would risk client timeouts and limit concurrency.
The API is the system’s primary interface. The web dashboard is an optional deployment addition; the system operates fully without it.
3.5.2 Web Dashboard
The web dashboard provides a summary dashboard, a job list with detail expansion, and a sample submission form. It uses HTMX rather than a JavaScript SPA framework; this eliminates the need for a build step, reduces the number of external dependencies, and avoids the need to duplicate rendering logic. The server renders HTML fragments, and HTMX swaps them into the page DOM via AJAX requests to dedicated /ui/* endpoints. For interactive charts (syscall frequency and timeline), the dashboard fetches JSON data from the API and renders them client-side using Chart.js.
3.6 Persistent Storage Design
Job metadata and analysis artifacts are stored in two "tiers". Structured job state such as status, timestamps, configuration, is persisted in an SQLite database, enabling efficient querying, listing and pagination. Analysis artifacts such as reports, telemetry event streams, and the submitted sample are instead stored as files on the host filesystem, where they are written during the container artifact extraction process and served directly. The job’s output directory path bridges the two tiers.
SQLite was chosen as it is embedded (no external database process), requires no configuration, and crucially, supports concurrent reads via WAL mode. Migration to a more scalable database (such as PostgreSQL) would be necessary for multi-instance deployments, and this is supported by the current interface-based abstraction design described in Section 4.9.1.
Two storage backends are provided: an SQLite database for persistent storage, and an in-memory store for development and testing purposes. The in-memory store is used by default, lending to zero-configuration startup; SQLite persistence is opted-into via a CLI flag.
3.7 Design Alternatives Considered
The original design used Tracee [1], an eBPF-based runtime security tool, as the telemetry source. Tracee was abandoned during development due to kernel compatibility issues and unreliable container scoping with Podman, detailed in Section 4.8.1. Three alternatives were evaluated as replacements, summarised in Table 9.
Table 9: Telemetry source alternatives considered.
| Option | Isolation | Observability | Notes |
|---|---|---|---|
| Falco | Namespace-based | eBPF events | Expected to address Tracee issues, but provides observability only; no isolation improvement. |
| Custom eBPF | Namespace-based | Custom probes | Maximum flexibility, but high implementation effort; no isolation improvement. |
| gVisor | User-space kernel | Built-in strace | Only option that improves both isolation and observability. Works on all kernel versions. |
gVisor was selected for the reasons stated in Section 4.8.1. The choice however did introduce some trade-offs. Firstly, gVisor’s strace output is not structured (plain-text), and as such required a custom parser (see Section 4.4). Secondly, gVisor imposes a performance overhead on syscall-intensive workloads; this is an accepted trade-off as the security benefit outweighs the cost for a malware analysis tool such as Malspect.
4 Implementation
4.1 Technology Stack
This section summarises key technologies used in the implementation of Malspect. Selections were guided by principles of minimal dependency footprint, compatibility with Go’s standard library, and suitability for security-sensitive workloads.
Table 10: Technology stack used in Malspect.
| Component | Technology | Role in System |
|---|---|---|
| Language | Go 1.23 | Primary programming language. Compiles to statically linked binaries for both the host orchestrator and in-container runner. |
| CLI Framework | Cobra | Provides the malspect command hierarchy: run local, serve, db clean. |
| HTTP Router | chi v5 | Routes REST API requests (/api/v1/*) and HTMX fragments. Handlers conform to standard net/http.HandlerFunc signature. |
| Container Runtime | Podman | Manages container lifecycle: create, execute, extract artifacts, cleanup. Invoked via os/exec rather than a container SDK. |
| Sandbox Runtime | gVisor | Runs as the OCI runtime for each analysis container. Intercepts syscalls and produces strace logs. |
| Database | SQLite | Persists job metadata via SQL with WAL mode for concurrent reads. |
| Frontend | HTMX | Renders the web dashboard using HTML fragments swapped into the DOM, eliminating the need for a build step. |
| Charts (Visualisation) | Chart.js | Renders syscall frequency and timeline charts from API data. |
The Go codebase declares only seven dependencies. Podman, gVisor, and SQLite are each accessed through standard library mechanisms - os/exec for process invocation, compiled regular expressions for telemetry parsing, and database/sql for query execution; rather than through dedicated client libraries or SDKs. The rationale for selecting these technologies is discussed in greater detail in Chapter 3.
4.2 Project Structure
Malspect is compiled into two binaries. The first, malspect, is built from cmd/malspect/ and serves as the host-side orchestrator. It provides the CLI interface, the REST API server, telemetry parsing, and heuristic analysis. The second, runner, is built from cmd/runner/ and is packaged into the container image. It executes inside the gVisor sandbox alongside the submitted sample, where it is responsible for copying the sample to a writeable directory, executing it within a set timeout, capturing standard output and error streams, and finally writing preliminary execution artifacts to the container’s output volume. The orchestrator subsequently supplements these artifacts with telemetry and static analysis results after they have been extracted from the container.
This separation ensures that the host-side codebase responsible for managing the database, API and host filesystem, is never present inside the sandboxed environment. Conversely, the runner is isolated and as such has no awareness of the telemetry parsing, heuristic analysis or persistence layers; it receives its configuration entirely through environment variables injected at container creation time.
The application logic is organised into the packages listed in Table 11. All packages reside within Go’s internal/ directory:
Table 11: Package structure of the Malspect codebase.
| Package | Responsibility |
|---|---|
cmd/malspect | Entry-point for the host-side orchestrator binary. |
cmd/runner | Entry-point for the in-container runner binary. |
internal/cli | CLI command definitions: run local, serve, db clean. |
internal/api | REST API handlers, HTMX fragment handlers, router configuration, HTTP server. |
internal/executor | Container creation, hardening configuration, Podman lifecycle management, telemetry processing. |
internal/runner | In-container sample execution, timeout enforcement, artifact writing. |
internal/telemetry | gVisor strace parsing, behavioural heuristic detectors, risk scoring, report generation. |
internal/scanner | Pre-execution static file analysis: hashing, entropy calculation, ELF metadata extraction. |
internal/job | Job data model, Store interface, SQLite and in-memory implementations. |
web/ | Static HTML, CSS, and JavaScript for the web dashboard. |
The entry-points of each binary is minimal. The orchestrator’s main.go consists of a single call to the CLI package’s root command executor. The runner’s main.go is similarly minimal, reading configuration from four environment variables; INPUT_DIR, OUTPUT_DIR, WORK_DIR, and TIMEOUT_SECONDS. The function then delegates to the runner package. The remainder of this chapter examines the significant packages in detail, following the order of the analysis pipeline: sample submission, container execution, telemetry parsing, behavioural analysis, and reporting.
4.3 Container Execution Pipeline
This section traces the lifecycle of a sample submission through the analysis pipeline, from submission to final report generation. The pipeline consists of four phases: static analysis, container creation, in-container execution, and post-execution processing.
4.3.1 Sample Submission and Static Analysis
Samples enter the system via two possible paths: the CLI (malspect run local --sample <path>), or the REST API (POST /api/v1/samples with a multipart form upload). Both paths converge on the same executor, ensuring identical analysis regardless of submission method.
Before any container is created, the sample is subjected to static analysis. This is performed by the scanner module on the host. The AnalyseFile function reads the sample and computes SHA-256 and MD5 hashes for identification, Shannon entropy over the raw byte distribution on a 0-8 scale, a count of printable ASCII string sequences of four or more characters, and the filetype determined from magic bytes.
The entropy calculation uses Shannon’s information entropy formula [20], computed over the byte frequency distribution of the entire sample file. Lyda and Hamrock [13] established the application of entropy analysis to the detection of packed and encrypted malware, computing entropy over fixed-length blocks of 256 bytes within PE sections and deriving statistical thresholds via controlled experiments. The whole-file approach adopted here is a simplification suited to the project’s scope; it provides a single indicator flag rather than per-section block analysis, and applies to ELF binaries and scripts rather than the PE format targeted by Lyda and Hamrock. Files exceeding the threshold of 7.0 are flagged as potentially packed or encrypted.
Results are serialised to a JSON file static_analysis.json in the job’s output directory for later integration into the final report.
4.3.2 Container Creation and Hardening
The executor module is responsible for preparing the hardened container environment through three steps: creating named volumes for writable mount points, resolving the gVisor runtime binary path, and constructing the container with hardening flags.
Two named Podman volumes are created for the /output and /work directories. Named volumes are utilized in place of tmpfs mounts to ensure data persistence; whereas tmpfs reside exclusively in-memory and are lost upon container termination, named volumes allow for the post-execution extraction of artifacts via podman cp. See Section 4.8.3 for more details.
The BuildCreateArgs function constructs the full podman create invocation. The hardening configuration, realising the defence-in-depth strategy described in Section 3.2, is shown in Listing 1.
Listing 1: Container hardening flags applied during creation.
func BuildCreateArgs(cfg ContainerConfig) []string {
    return []string{
        "create", "--name", cfg.Name,
        "--runtime=" + cfg.RunscPath,
        "--security-opt=label=disable",
        // gVisor strace via OCI annotations
        "--annotation=dev.gvisor.flag.strace=true",
        "--annotation=dev.gvisor.flag.debug-log=" + cfg.GvisorLogDir + "/",
        // Hardening
        "--read-only",
        "--cap-drop=ALL",
        "--security-opt=no-new-privileges",
        "--network=none",
        "--pids-limit=64",
        "--memory=256m",
        "--cpus=0.5",
        // Writable mounts
        "--tmpfs=/tmp:rw,noexec,nosuid,nodev,size=64m",
        "-v", cfg.WorkVolume + ":/work:rw",
        "-v", cfg.OutputVolume + ":/output:rw",
        "-v", cfg.InputDir + ":/input:ro",
        // Runner environment
        "-e", fmt.Sprintf("TIMEOUT_SECONDS=%d", cfg.Timeout),
        "-e", "WORK_DIR=/work",
        "-e", "OUTPUT_DIR=/output",
        "-e", "INPUT_DIR=/input",
        cfg.Image,
    }
}
Two points merit further attention. First, gVisor’s strace functionality is enabled via OCI annotations (dev.gvisor.flag.strace=true) rather than standard container flags [25]. OCI annotations are the mechanism through which gVisor exposes its kernel-level configuration to container runtimes. Second, the /tmp mount is configured with noexec to prevent execution of files written to /tmp; a common staging location for dropped payloads [15] (T1074.001).
4.3.3 In-Container Execution
Once the container is created, it is started in attached mode (podman start -a), blocking until execution completes. Inside the container, the runner binary performs the following sequence.
The output and work directories are created. The sample is then copied from the read-only /input mount to the writable /work volume with mode 0700 (owner-executable), as the container’s root filesystem is mounted read-only.
The sample is executed with a minimal, deterministic environment consisting of two variables: HOME and PATH. No other environment variables are present, ensuring reproducible execution behaviour independent of the host.
The runner creates a new process group for the sample via Setpgid. This is critical for timeout enforcement, allowing the runner to send SIGKILL to the entire process group (i.e. child processes included) rather than just the sample itself. The exit code is set to 124 on timeout, following the GNU coreutils convention [8]. For non-timeout failures, the exit code is inherited from the process’ WaitStatus; if the process was terminated by a signal, the exit code follows the standard UNIX convention of 128 plus the signal number.
Regardless of the exit reason, the runner writes execution artifacts to the output volume: stdout.log, stderr.log, and metadata.json containing the exit code, time-out duration, timeout status, execution duration, and start timestamp. A separate WriteFailureArtifacts function handles cases where the sample failed to start at all; i.e. if the sample is missing or the copy fails. This ensures the host-side executor always has artifacts to extract. Each failure is assigned a distinct exit code to aid debugging.
4.3.4 Artifact Extraction and Report Generation
After execution completes, the orchestrator performs four post-execution steps on the host.
First, podman cp copies all artifacts from the container’s output volume to the host filesystem. The executor reads metadata.json to populate the job’s exit code and timeout status.
Second, the gVisor strace logs, written to a host-accessible directory via the debug-log OCI annotation [25], are parsed by ParseLogDir, which reads all files matching the *.boot.txt pattern and produces a slice of structured Event values. These are then serialised into events.json for later retrieval by the API. Raw gVisor log files are deleted to conserve disk space. The telemetry parsing logic is detailed in Section 4.4.
Third, GenerateSummary aggregates the parsed events into a TelemetrySummary containing syscall frequency counts, unique process counts, file access counts, network connection counts. It then crucially invokes AnalyseBehavior to run the heuristics detectors and compute the risk score. The behavioural analysis engine is described in Section 4.5.
Fourth, WriteArtifactsWithOptions produces the definitive report.json, merging the four data sources (execution metadata from runner, static analysis results, telemetry summary, and behavioural analysis results). This is also where the static and dynamic risk scores are combined; if the static scanner flagged high entropy (greater than 7.0, see 4.3.1), five points are added to the risk score. The integration of static and dynamic analysis indicators into a unified risk assessment reflects the complementary approach established in malware analysis literature [5]. This step overwrites the preliminary report written inside the container, which lacked telemetry and static analysis data.
Finally, a deferred cleanup takes place, removing the container and both named volumes via podman rm -f and podman volume rm -f. This function is called even if preceding steps fail, preventing resource leakage.
4.4 Telemetry Parsing
This section describes how raw gVisor strace log output is transformed into structured, analysable data.
4.4.1 Log Format
gVisor writes strace output to log files named *.boot.txt in the directory specified by the debug-log OCI annotation [25]. Each line follows the format:
Listing 2: gVisor strace log line format.
I<MMDD> <HH:MM:SS.µs> <internal> strace.go:<line>] [<PID>:<TID>] <process> E|X <syscall>(<args>) = <ret> (<duration>)The E and X markers denote entry and exit events respectively; gVisor logs both for every syscall. A functional example is as follows:
Listing 3: gVisor strace log line example.
I0322 13:06:30.286882 1 strace.go:127] [ 2: 2] sh X write(0x1 host:[2], 0x7ec45f46e080 "Hello World!", 0x5) = 0x5 (5) (44.692µs)This line records the exit of a write syscall by process sh (PID 2), writing the string "Hello World!" to file descriptor 1 (stdout), returning 5 bytes written in 44.692 microseconds.
Each parsed line produces an Event value (Listing 4). The first eight fields are extracted from every strace line; the remaining fields are populated by syscall-specific arguments.
Listing 4: The Event struct representing a parsed syscall.
type Event struct {
    Timestamp   time.Time     `json:"timestamp"`
    PID         int           `json:"pid"`
    TID         int           `json:"tid"`
    ProcessName string        `json:"process_name"`
    Syscall     string        `json:"syscall"`
    Entry       bool          `json:"entry"`
    ReturnValue int           `json:"return_value,omitempty"`
    Duration    time.Duration `json:"duration_ns,omitempty"`
    RawArgs     string        `json:"raw_args,omitempty"`
    Path        string        `json:"path,omitempty"`
    Argv        []string      `json:"argv,omitempty"`
    Address     string        `json:"address,omitempty"`
    FD          int           `json:"fd,omitempty"`
    Data        string        `json:"data,omitempty"`
    Flags       string        `json:"flags,omitempty"`
}
4.4.2 Parsing Implementation
The parser uses six compiled regular expressions (regex) to extract structured data from the plaintext log lines. The primary regex matches the overall line’s structure, extracting date, time, PID, TID, process name, entry/exit marker, syscall name, and raw argument strings. A secondary regex extracts the return value and duration from exit lines. Two further patterns then handle path extraction from hex-prefixed arguments and address extraction from connect arguments.
Parsed fields vary by syscall. The parseSyscallArgs function dispatches to specialised argument extractors, based on the syscall name:
Table 12: Syscall-specific argument extraction strategies.
| Syscall | Extracted Fields | Parsing Strategy |
|---|---|---|
| execve | Path, argv array | Split on first comma; extract path after hex address; parse bracketed string array. |
| openat | Path, flags | Multiple fallback strategies: quoted strings, hex-prefixed paths, comma-delimited fields. Flag extraction by matching known O_ constants. |
| connect | Address (IP:port) | Regex extraction of Addr: and Port: fields from gVisor’s struct representation. AF_UNIX sockets are excluded. |
| write | File descriptor, data | FD parsed from hex; quoted data truncated to 100 characters. |
| Path-only syscalls (stat, unlink, chmod, etc.) | Path | Regex extraction of path following hex address. |
The scanner buffer is increased to 1MB per line, as gVisor strace lines containing execve arguments may exceed the 64KB buffer. Lines lacking the "strace.go:" marker are skipped as debug logs contain non-strace diagnostic information.
Two quirks of gVisor’s output required special handling and workarounds. First, Go’s time.ParseDuration does not recognise the Unicode micro sign (µ). Therefore, the parser substitutes it with us before parsing. Additionally, gVisor’s openat format places two paths on one line; the working directory after AT_FDCWD and the actual target after a hex address. This required a fallback strategy to handle such cases.
4.5 Behavioural Analysis Engine
The analysis engine uses a declarative detector registry. Each detector is defined as a struct containing its MITRE ATT&CK metadata, severity level, a description template, and a detection function. The AnalyseBehaviour function iterates over this registry, invoking each detector against the event stream and collecting indicators.
Two filtering steps reduce false positives. Events from PID 1 (the runner process) are excluded, as they represent infrastructure rather than sample behaviour. Additionally, only exit events are examined, as to avoid double-counting of entry/exit pairs.
4.5.1 Detectors
Seven detectors are implemented, each aligned with a MITRE ATT&CK tactic [15].
Table 13: Behavioural heuristic detectors and their detection logic.
| Detector | Tactic (ID) | Sev. | Detection Logic |
|---|---|---|---|
| Execution | TA0002 | 2 | Counts execve, clone, fork, vfork. The sample’s own execve is excluded; detection triggers only if more than one execve is observed. |
| Persistence | TA0003 | 3 | Detects writes to cron directories, systemd unit paths, init.d, and shell profile files (.bashrc, .profile). |
| Privilege Escalation | TA0004 | 3 | Detects setuid(0) and setgid(0) calls. Calls with non-zero arguments are excluded. Also detects SUID/SGID bit setting via chmod in drop locations. |
| Defence Evasion | TA0005 | 2 | Detects file deletion (unlink) and log truncation (openat with O_TRUNC) in log and drop locations. |
| Discovery | TA0007 | 1 | Detects reads of sensitive files: /etc/passwd, /etc/shadow, SSH keys, AWS credentials, shell history. /proc/self/ paths are excluded as Go’s runtime reads these at startup. |
| Command & Control | TA0011 | 3 | Detects connect and sendto with network addresses. These always fail due to --network=none, but gVisor logs the attempt at the syscall level. |
| File Dropper | TA0002 | 2 | Detects openat with O_CREAT/O_WRONLY in drop locations (/tmp, /dev/shm, /bin, etc.), data writes to FDs above 2, and chmod in drop locations. |
The AnalyseBehaviour function iterates over this registry, invoking each detector against the event stream, collecting indicators, and computing the aggregate risk score using the model described in Section 3.4.3. The resulting BehaviourAnalysis struct containing the indicator list, score, and classification, is returned for inclusion in the report.
Two aspects of the detectors’ implementation merit discussion. The Discovery detector must account for the Go runtime’s own filesystem activity: Go reads /proc/self/mountinfo and /proc/self/cgroup on startup, which would result in a false positive if not explicitly excluded. The isSensitiveFile function handles this by distinguishing process-internal paths (prefixed with /proc/self/ or /proc/<pid>/) from system-wide paths like /proc/cpuinfo, flagging only the latter.
The Command & Control detector has a different challenge: all containers in the system are configured with the flag --network=none, so every connect and sendto call fails. However, gVisor intercepts these syscalls at the Sentry level before they reach any network stack, so the target address and the attempt itself is still captured in telemetry. The detector can use these failed connection attempts as evidence of C2 behaviour.
4.6 REST API and Web Interface
4.6.1 API Server
The API is built on chi v5 [23], with middleware providing request ID generation, real IP resolution, structured logging, and panic recovery. Routes are organised into three groups, with endpoints summarised in Table 14.
Table 14: REST API endpoints.
| Method | Path | Description |
|---|---|---|
| GET | /health | Liveness check. |
| POST | /api/v1/samples | Submit a sample for analysis (multipart form, 32 MB limit). |
| GET | /api/v1/jobs | List all jobs (supports ?limit=N). |
| GET | /api/v1/jobs/{id} | Retrieve job details. |
| GET | /api/v1/jobs/{id}/report | Retrieve the analysis report. |
| GET | /api/v1/jobs/{id}/artifacts/{name} | Retrieve a specific artifact file. |
Sample submission is asynchronous: the handler validates the upload, creates a job record, and launches the executor in a background goroutine with context.Background(). The background context ensures analysis continues even if the HTTP client disconnects. The handler returns immediately with a 202 Accepted status and the job ID.
Input validation consists of regex-based image name verification and filepath.Base() sanitisation of artifact names to prevent path traversal. Internal file paths are excluded from JSON output via json:"-" struct tags.
4.6.2 Web UI
The web interface uses HTMX to request server-rendered HTML fragments via AJAX, which are swapped into the page DOM. Three views are provided: a dashboard with summary statistics and recent jobs, a paginated job list with expandable detail panels, and a sample submission form. The /ui/* endpoints return HTML fragments; the /api/v1/* endpoints return JSON responses. Both coexist on the same server.
Chart.js renders two visualisations in the job detail view: a syscall frequency pie chart, and a timeline chart of syscall activity over the execution duration. These are rendered client-side from data fetched via the JSON API.
4.7 Data Persistence
The persistence layer is built on the Store interface (Listing 5), which defines the six methods Create, Get, Update, List, DeleteAll, and Close; in other words, CRUD operations adjusted to the system’s requirements. Two implementations are provided: SQLiteStore for persistent storage, and InMemoryStore for development and testing, i.e. data is not persisted between runs.
Listing 5: The Store interface for job persistence.
type Store interface {
    Create(job *Job) error
    Get(id string) (*Job, error)
    Update(job *Job) error
    List(limit, offset int) ([]*Job, int, error)
    DeleteAll() (int, error)
    Close() error
}
SQLiteStore enables WAL mode on initialisation, permitting concurrent reads during writes; this is necessary as the API server may handle read requests while a background goroutine writes analysis results. A busy timeout of 5000ms handles contention. The schema is created idempotently via CREATE TABLE IF NOT EXISTS, and all queries use parameterised statements (preventing SQL injection).
Backend selection is controlled by the -database flag: providing a path enables SQLite, omission defaults to in-memory storage.
4.8 Technical Challenges
4.8.1 Tracee to gVisor Pivot
The original design used Tracee, an eBPF-based runtime security tool [1] as the telemetry source. Two problems made this untenable:
- Podman recognition issues. Tracee’s container enricher failed to recognise Podman containers, requiring custom PID namespace based filtering that proved fragile, and gave cause for concern over potential attack vectors exploiting this lack of isolation between the container and host.
- Kernel Compatibility. Tracee encountered kernel compatibility issues on Linux 6.18, where modifications to internal kernel structures caused the eBPF probes to fail during initialization. Consequently, a critical telemetry gap occurred during the initial stages of container execution, preventing the capture of early-process events.
Such implementation shortcomings were deemed unacceptably risky given the system’s security-critical nature. gVisor proved to be a uniquely suitable replacement. The Google-backed project describes itself as "the missing security layer for running containers efficiently and securely" [24], and in this context the description is apt. Other alternatives separated isolation and observability concerns; gVisor allows the implementation of both through a single mechanism.
The advantages of gVisor came at a cost however. gVisor’s strace output is not structured (plaintext) in contrast to other telemetry sources, and as such required a custom parser, developed empirically through trial and error, i.e. by examining log outputs across multiple sample executions, and thus handling format variations through multiple fallback extraction strategies. This represented a significant implementation effort, described in-detail in Section 4.4.
4.8.2 Podman Runtime Path Resolution
The -runtime flag passed a relative path to gVisor. This worked from the CLI (whose working directory resolved correctly), but failed from the API server (due to a different working directory). The fix converts relative paths to absolute via Go’s filepath.Abs() function. The executor was also changed from cmd.Output() to cmd.CombinedOutput() to capture Podman’s stderr, which had been silently discarded previously.
4.8.3 Container Storage Limitations
An early implementation used tmpfs mounts for /output and /work:
Listing 6: tmpfs mount specification.
"--tmpfs=/output:rw,size=64m",
"--tmpfs=/work:rw,size=64m",
Since tmpfs is a RAM-based filesystem, its contents were lost upon container termination, causing podman cp to fail. Switching to named Podman volumes, which are persistent, resolved this issue.
4.9 Incomplete and Outstanding Work
The following features were designed and/or planned, but not implemented within the project timeline.
4.9.1 Kubernetes Orchestration
The JobExecutor and Store interfaces support pluggable backends; a Kubernetes executor and PostgreSQL (or other relational database) could be implemented without modification of existing code.
Listing 7: The JobExecutor interface enabling pluggable execution backends.
type JobExecutor interface {
    Execute(ctx context.Context, j *job.Job) error
}
4.9.2 Additional ATT&CK Detectors
Seven detectors are implemented, covering six of the fourteen ATT&CK Enterprise tactics [15]. Each tactic contains numerous “techniques” (individual attack patterns), of which Malspect covers twelve in total.
Of the seven absent tactics, four; “Reconnaissance”, “Resource Development”, “Initial Access”, and “Lateral Movement”, describe pre-compromise or network-level activities that fall outside what a single-host sandbox can observe. Furthermore, many techniques target OS-specific mechanisms (e.g. Windows PowerShell, Registry, WMI, etc.) which are non-applicable to the Linux-based environment. The remaining absent tactics are observable at the syscall level, and as such make viable candidates for additional detector implementation.
The declarative registry pattern described in Section 4.5 makes such additions straightforward.
5 Evaluation
This chapter evaluates the system through automated testing, a benchmark suite run against pre-collected job data, and an appraisal of how well the completed system meets the objectives and requirements established in Chapter 2.
5.1 Testing Methodology
The project employs a multi-layered testing strategy spanning unit tests and integration tests. Four test files cover the core functionality of the system, implementing 68 test cases across two packages. Table 15 summarises the test suite.
Table 15: Test suite summary.
| File | Tests | Coverage |
|---|---|---|
| store_test.go | 13 | MemoryStore CRUD, pagination, sort order, concurrency. |
| sqlite_test.go | 18 | SQLite persistence via shared test suite. |
| parser_test.go | 22 | gVisor strace parsing: lines, timestamps, durations, full files. |
| heuristics_test.go | 15 | Persistence detector, scoring model, classification thresholds. |
| Total | 68 |
5.1.1 Unit Testing
The bulk of the test suite consists of table-driven unit tests, a Go testing pattern in which each test function iterates over a slice of input/expected-output pairs. The heuristic detectors are tested through a combination of dedicated test cases for the persistence detector, and a multi-tactic integration test that exercises all seven detectors. The scoring model: risk calculation, classification thresholds, and confidence-from-evidence-count mapping are all tested. The Store interface is tested through a test suite that runs identical assertions against both the in-memory and SQLite backends, verifying that both implementations behave identically. The parser tests verify that gVisor’s strace log format is correctly parsed into structured event logs.
5.1.2 Integration Testing
Three integration tests exercise the analysis pipeline end-to-end using synthetic event streams. These verify that a multi-tactic event sequence produces the expected indicators and “malicious” classification. It also verifies that a minimal benign event stream scores zero, and that triggering all seven detectors simultaneously reaches the score cap of 100.
5.2 Evaluation Results
The system includes a built-in benchmark suite (malspect benchmark) that evaluates the analysis pipeline against pre-collected job data. The suite was run against 33 completed jobs, spanning all nine preset sample types (each sample targeting a different ATT&CK tactic), with each sample executed at least three times to verify determinism.
5.2.1 Detection Accuracy
Table 16 summarises the detection accuracy results, condensed to one row per sample type. Each sample was run multiple times, producing identical results as expected.
Table 16: Detection accuracy by sample type (33 jobs, 9 sample types).
| Sample | Expected | Actual | Detectors Triggered | Score |
|---|---|---|---|---|
| hello | benign | benign | (none) | 0 |
| execution.sh | benign | benign | execution | 20 |
| discovery.sh | ben./susp. | suspicious | execution, discovery | 30 |
| file_dropper.sh | suspicious | suspicious | execution, file_dropper | 34 |
| c2.sh | suspicious | suspicious | execution, discovery, C2 | 48 |
| defence_evasion.sh | susp./mal. | malicious | execution, defence_evasion, file_dropper | 60 |
| privesc.sh | malicious | malicious | execution, privilege_escalation, file_dropper | 55 |
| persistence.sh | malicious | malicious | execution, persistence, file_dropper | 64 |
| multi.sh | malicious | malicious | execution, persistence, discovery, C2, file_dropper | 92 |
All jobs were classified as expected, with no false positives. The scores form a gradient from benign (0) through suspicious (20-48) to malicious (55-92), consistent with the severity weighting model described in Section 3.4.3. The execution detector fires on nearly every sample, as child processes spawning (execve) is inherent to shell execution. This is expected behaviour, and its severity (tier 2) means this action alone does not itself indicate malicious intent.
These results validate the analysis pipeline against its intended test corpus, i.e. all nine samples are synthetic, author-created scripts, each targeting one or several specific detectors. The system’s accuracy against real-world malware, which exhibits more complex and overlapping behaviours, remains untested.
5.2.2 Reproducibility
Table 17 presents reproducibility results.
Table 17: Score reproducibility across repeated runs.
| Sample | Runs | Min | Max | Mean | StdDev | Class | Cats |
|---|---|---|---|---|---|---|---|
| hello | 3 | 0 | 0 | 0.0 | 0.00 | ✓ | ✓ |
| execution.sh | 3 | 20 | 20 | 20.0 | 0.00 | ✓ | ✓ |
| file_dropper.sh | 3 | 34 | 34 | 34.0 | 0.00 | ✓ | ✓ |
| c2.sh | 3 | 48 | 48 | 48.0 | 0.00 | ✓ | ✓ |
| discovery.sh | 3 | 30 | 30 | 30.0 | 0.00 | ✓ | ✓ |
| defence_evasion.sh | 3 | 60 | 60 | 60.0 | 0.00 | ✓ | ✓ |
| persistence.sh | 3 | 64 | 64 | 64.0 | 0.00 | ✓ | ✓ |
| privesc.sh | 3 | 55 | 55 | 55.0 | 0.00 | ✓ | ✓ |
| multi.sh | 3 | 92 | 92 | 92.0 | 0.00 | ✓ | ✓ |
Every sample type produces identical scores, classifications, and detector categories across repeated runs. This is expected: the heuristic analysis is deterministic; given the same event stream, the detectors should produce the same results. The underlying gVisor strace data does vary slightly in event count between runs (the simple baseline hello sample, for instance, produced between 946 and 1912 events across several runs), but the signals the detectors look for are consistent regardless of background noise from the container runtime.
5.2.3 Isolation Verification
Five isolation controls were verified against the job data. Table 18 summarises the results.
Table 18: Isolation verification results.
| Control | Tested By | Method | Result |
|---|---|---|---|
| Network isolation | c2.sh | connect() logged by gVisor but blocked by --network=none. | PASS |
| Filesystem isolation | persistence.sh | openat() to /etc/ logged; write denied by read-only rootfs. | PASS |
| PID limits | all samples | Max 13 unique PIDs observed (limit: 64). | PASS |
| Timeout enforcement | all samples | No samples exceeded the configured timeout. | PASS |
| Non-root execution | all samples | Container runs as UID 100, GID 101. | PASS |
The network and filesystem tests are the most informative of the five. They demonstrate that the system captures an attempt (thus enabling detection), while the hardening prevents the effect itself (thus maintaining isolation). The C2 sample’s connect() calls are logged by gVisor at the syscall level, but then blocked by the network isolation flag. Similarly, the persistence sample’s writes to /etc/crontab are logged before being denied by the read-only rootfs. This dual property, observe the intent, then prevent the impact, is a key principle of the system’s design.
5.2.4 Performance
Table 19 presents aggregate timing for the three stages of the analysis pipeline, measured across all jobs.
Table 19: Post-execution analysis pipeline performance (n=33 jobs, 946–3,314 events per job).
| Pipeline Stage | Min | Avg | Max |
|---|---|---|---|
| Event loading (JSON deserialisation) | 2.0 ms | 5.8 ms | 12.2 ms |
| Heuristic analysis | 20 µs | 282 µs | 1.9 ms |
| Summary generation | 32 µs | 375 µs | 1.4 ms |
| Total pipeline | 2.1 ms | 6.4 ms | 15.4 ms |
Table 20: Total container execution duration by sample type (includes startup, execution, and artifact extraction).
| Sample | Runs | Min | Avg | Max |
|---|---|---|---|---|
| hello | 3 | 309 ms | 390 ms | 459 ms |
| persistence.sh | 3 | 358 ms | 365 ms | 377 ms |
| defence_evasion.sh | 3 | 363 ms | 404 ms | 432 ms |
| file_dropper.sh | 3 | 406 ms | 439 ms | 474 ms |
| execution.sh | 3 | 370 ms | 460 ms | 515 ms |
| privesc.sh | 3 | 418 ms | 459 ms | 485 ms |
| discovery.sh | 3 | 482 ms | 587 ms | 690 ms |
| multi.sh | 3 | 540 ms | 593 ms | 639 ms |
| c2.sh | 3 | 2,428 ms | 2,501 ms | 2,601 ms |
The post-execution analysis pipeline averages 6.4 ms, with JSON deserialisation accounting for approximately 90% of the total time. Heuristic analysis itself averages 282 µs, indicating that adding additional detectors should have negligible impact on analysis time.
Total execution ranges from 309 ms to 690 ms for most samples, with the exception of c2.sh which averages 2.5 seconds. This outlier can be explained by the sample’s connect() calls, which must timeout (due to the --network=none restriction) before the container can exit. All other samples complete well under one second, suggesting that container startup and gVisor initialisation dominate execution time for simple samples.
Published benchmarks indicate gVisor imposes a performance overhead of approximately 2× on a per-syscall basis compared to native runtimes [27]. This is the cost of its core security property, i.e. syscall interception in user-space. Even with this overhead, container-based execution remains substantially lighter than VM-based counterparts, which could impose >40% overhead on I/O-intensive workloads [6, 18]. Within this project, a comparative benchmark against the native OCI runtime was not conducted, as the telemetry collection itself is dependent on gVisor.
5.2.5 False-Positive Assessment
To assess the system’s specificity, eleven benign Linux programs were analysed using the same pipeline. Eight are shell scripts running common utilities such as ls, grep, and find. Two further scripts interact more deeply with the filesystem (cat /proc/cpuinfo and tar to create an archive in /tmp). The eleventh is the compiled Go hello binary already used as a benign baseline. Table 21 summarises the results.
Table 21: False-positive assessment: benign sample classification results.
| Sample | Command | Score | Class | Detectors |
|---|---|---|---|---|
| ls_root | ls / | 20 | benign | execution |
| grep_passwd | grep root /etc/passwd | 20 | benign | execution |
| find_tmp | find /tmp -name *.txt | 20 | benign | execution |
| curl_version | curl --version | 20 | benign | execution |
| whoami | whoami | 20 | benign | execution |
| bash_echo | echo hello && sleep 1 | 20 | benign | execution |
| uname_info | uname -a | 20 | benign | execution |
| env_list | env | 20 | benign | execution |
| cat_cpuinfo | cat /proc/cpuinfo | 27 | suspicious | execution, discovery |
| tar_archive | tar czf /tmp/test.tar.gz /etc/hostname | 34 | suspicious | execution, file_dropper |
| hello | Compiled Go binary | 0 | benign | (none) |
Nine of the eleven samples were correctly classified as benign. Two false positives are however observed, each with a distinct cause.
The Execution detector fires on every shell script, as Bash forks child processes to execute each command. This produces several execve/fork events, triggering the detector with high confidence. The contribution is 20 × 1.0 = 20 points, placing all shell-script samples at the upper boundary of the benign classification (0-20). The compiled hello binary does not invoke a shell interpreter and thus scores zero, confirming that this effect is specific to the shell execution model rather than a defect in the analysis engine.
The Discovery detector triggers upon exceeding a threshold requiring two or more distinct sensitive file reads, so that isolated /etc/passwd reads such as ones caused by libc’s name service switch (NSS) do not produce a false positive. This threshold correctly suppresses Discovery for eight of the ten shell scripts. However, cat_cpuinfo reads both /etc/passwd (via NSS) and /proc/cpuinfo, producing two distinct sensitive file reads that exceed the threshold. The resulting 10 × 0.7 = 7 additional points raise its score to 27, crossing into the suspicious classification.
The tar_archive sample scores 34, because tar creates /tmp/test.tar.gz, triggering the File Dropper detector with medium confidence, thus contributing 20 × 0.7 = 14 additional points.
Despite these two false positives, no benign sample reaches the “malicious” threshold (51+). The false positives stem from identifiable causes discussed above, and as such could be addressed through further refinement of the detectors, or could otherwise be accepted as within-tolerance of the system’s purpose, i.e. to detect activity that is characteristic of malicious behaviour.
5.3 Code Coverage
Automated tests cover two packages where correctness is critical: the job package has a test coverage of 82.5%, covering both storage backends (CRUD operations), concurrency, and immutability. The telemetry package achieves 64.6% coverage, testing the scoring model, classification thresholds, and the strace parser. The executor package is not unit tested as it directly invokes Podman; correctness is instead verified indirectly through the integration tests described in Section 5.1.
Extending coverage to the remaining packages is straightforward given the interface based design, but was not pursued within the timeline of the project.
5.4 Objectives Appraisal
5.4.1 Functional Requirements
Table 22: Functional requirements appraisal.
| Req | Status | Evidence |
|---|---|---|
| FR1 | Met | 33 samples executed successfully across 9 sample types. |
| FR2 | Met | Five isolation controls verified (Table 18); gVisor prevents direct host kernel exposure. |
| FR3 | Met | 946–3,314 syscall events captured per sample, including file operations, process creation, and network activity. |
| FR4 | Met | Containers are created, configured, executed, and destroyed programmatically via Podman. |
| FR5 | Met | 8 REST API endpoints and 13 UI fragment endpoints operational. |
| FR6 | Met | JSON reports generated with static analysis, behavioural indicators, risk score, and classification. |
All functional requirements set out are met. The system accepts user-supplied binaries, executes them in a hardened container, captures telemetry, and produces a structured report accessible through both the CLI and REST API.
5.4.2 Non-Functional Requirements
Table 23: Non-functional requirements appraisal.
| Req | Status | Evidence |
|---|---|---|
| NFR1 | Met¹ | Defence-in-depth hardening (Section 3.2); all isolation checks pass; gVisor intercepts all syscalls in user-space. No adversarial testing was conducted. |
| NFR2 | Met | Analysis pipeline averages 6.4 ms; total execution under 700 ms for most samples. |
| NFR3 | Met | Store and JobExecutor interfaces decouple core logic from runtime and storage implementations. The REST API provides an integration surface for automated workflows. |
| NFR4 | Met | Timeout enforcement verified; 33/33 jobs completed without unhandled errors. |
| NFR5 | Met | CLI with subcommands and help output; REST API; web dashboard with submission form and visualisations. |
¹ NFR1 (Security) is marked as met on the basis of the defence-in-depth configuration described in Section 3.2 and the isolation verification results in Table 18. However, no adversarial testing was conducted, i.e. no real malware has been tested against the system as of yet. The security claim rests on gVisor’s published security model and the hardening measures applied, not on empirical attack testing.
5.5 Usability
The system provides three interfaces. The CLI exposes subcommands for local analysis (run), starting the API server (serve), running the benchmark suite (benchmark), and database management (db). Each subcommand supports --help output and validates flags prior to execution.
The REST API accepts sample submissions via multipart file upload and returns structured JSON responses. Clients can poll for the job’s status using the returned job ID. The asynchronous design avoids client timeouts during long-running analyses.
The web dashboard, built with HTMX, provides a submission form, paginated job list, and job detail view. Chart.js is used to render interactive charts of syscall frequency and timeline data. Figures 4 and 5 show the job detail view of a multi-behaviour sample classified as malicious.
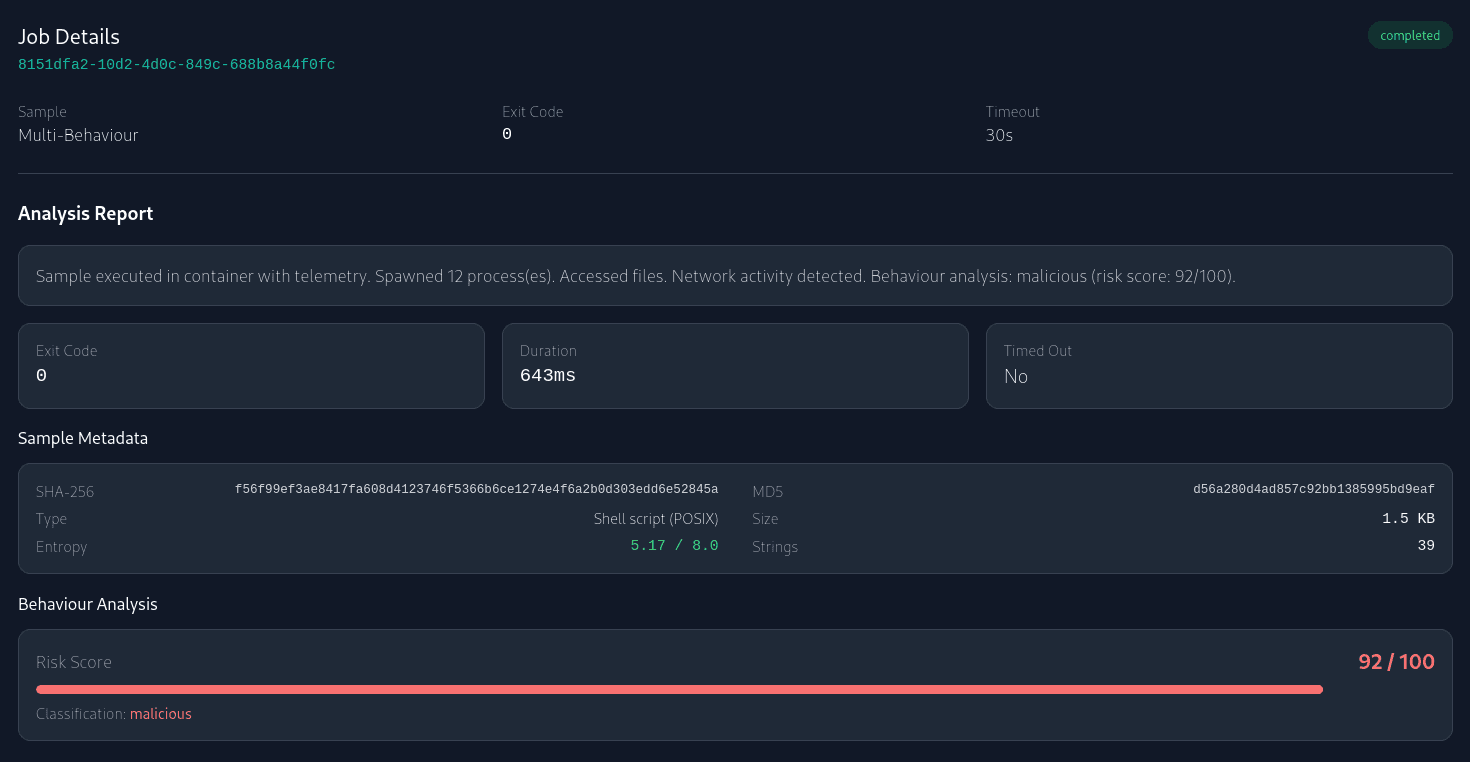
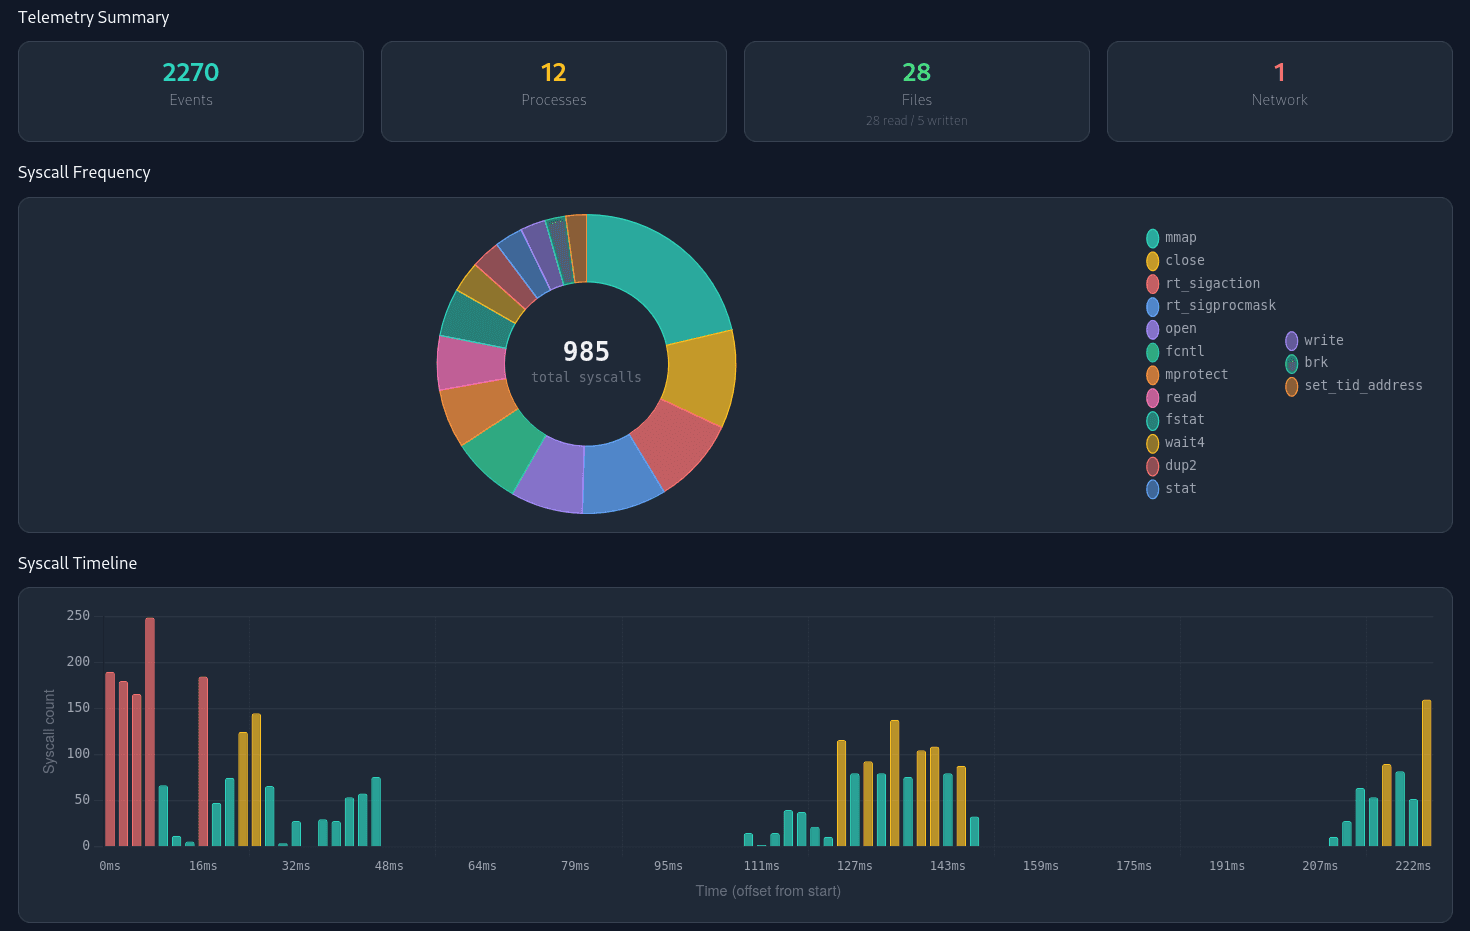
5.6 Known Limitations
- Synthetic samples. All nine samples are author-created shell scripts and binaries. No real malware has been tested against the system as of yet. Testing against real malware would be a critical next step, but was not pursued within the timeline of the project due to safety and ethical considerations.
- No adversarial testing. The isolation claims rely on gVisor’s published security model and applied hardening measures. No container escape attempts, sandbox evasion techniques, or gVisor CVE analysis were conducted. A formal threat model and controlled adversarial experimentation would substantiate the security claims empirically.
- Expert-assigned scoring weights. The severity tiers and confidence multipliers in the risk scoring model are manually assigned, not empirically calibrated against a labelled dataset. Different weight assignments would produce different risk scores (and classifications) for the same sample.
- Regex-based telemetry parsing. gVisor’s strace output is plaintext with no structured format. The parser thus relies on regular expressions, which are brittle, and could break with future changes to gVisor’s output format.
- False-positive rate. The false-positive assessment (Section 5.2.5) correctly classifies nine of eleven benign samples, with two false positives. While no benign sample reaches the “malicious” threshold, the detectors are triggered by legitimate behaviour which could be filtered out through careful refinement of the detectors. That said, given the nature of the system, it could be deemed preferable to falsely flag benign activity as opposed to allowing malicious activity to bypass the detectors.
6 Conclusions
6.1 Summary of Achievements
Malspect is a container-based malware execution and analysis environment that accepts user-supplied binaries, executes them in a hardened Podman container running under gVisor, captures syscall-level telemetry, and produces a report detailing behavioural classification. Seven heuristic detectors spanning six MITRE ATT&CK tactics classify observed behaviour through a three-tier risk scoring model. Evaluation against benchmark jobs demonstrates the system’s accuracy and reliability. A 6.4 ms average analysis pipeline (Table 19) and sub-700 ms average execution time for most samples (Table 20) demonstrates the system’s practicality through container-based execution. All set-out functional and non-functional requirements are met (Tables 22 and 23).
6.2 Conclusions
The project set out to investigate whether container-based isolation is viable for lightweight malware analysis. The complete system demonstrates this feasibility: defence-in-depth hardening combined with gVisor’s user-space syscall interception captures comprehensive telemetry and produces classifications without external monitoring tools. gVisor’s ability to observe intent at the syscall level while the hardening prevents its effect, proved particularly well-suited.
Though the system demonstrates robust isolation through its defence-in-depth configuration, the security claims remain empirically unvalidated. No real malware or adversarial testing was conducted. The project demonstrates that such an environment can be configured and operated, not that it cannot be breached with certainty.
As such, the completed system demonstrates that a lightweight, container-based analysis pipeline can produce structured behavioural classifications from raw sample binaries with sub-second turnaround for most samples. The architecture is functional end-to-end: samples are accepted, execute in isolation, are observed at the syscall level, and classified automatically against established adversary taxonomy.
6.3 Reflection
The most significant divergence from the original plan was the replacement of Tracee with gVisor. This pivot consumed considerable resources and implementation time (Figure 6), during which the telemetry parser was rewritten and the container creation logic substantially altered. The initial assumption that an eBPF-based tool would provide the most practical and comprehensive telemetry source proved more nuanced; the combination of Tracee’s issues (Section 4.8.1) and gVisor’s ideal alignment with the project’s requirements resulted in the pivot. For such a project, perhaps a pure eBPF-based solution may be the most appropriate allowing for limitless flexibility, however this would have been prohibitively resource-intensive to implement, and would have considerably weakened the system’s security posture through the absence of gVisor’s user-space kernel.
The time available for testing and evaluation ultimately proved slimmer than anticipated. While the unit tests and benchmark suite were completed during the implementation and evaluation stages respectively, other areas such as real malware testing and adversarial testing were not completed. Given even a few additional weeks, these empirical validations would have been the top priority.
The project required significant learning in previously unfamiliar areas such as container security, Linux namespace semantics, and the MITRE ATT&CK taxonomy. Regex-based parsing of gVisor’s unstructured log output proved more difficult than anticipated; the iterative, trial-and-error approach required to handle its format variations (Section 4.4) was particularly experimental. Other skills such as Go, Linux internals, and software design patterns, were deepened rather than newly acquired. Architectural planning, HTMX, and academic writing were also developed throughout the project. An overview of the project’s timeline is provided in Figure 6.
6.4 Project Timeline
6.5 Future Work
Real malware testing. Validation against a labelled dataset of real malware would be the critical next step. This would test both detection accuracy and isolation effectiveness under adversarial conditions, and would provide empirical evidence for the security claims.
Additional ATT&CK tactics. As discussed in Section 4.9.2, extension of current detectors is a straightforward process. Implementing additional tactics, as well as a greater number of techniques per tactic, would improve the system’s coverage and accuracy.
AI-assisted analysis. The structured event logs and existing report format provide natural integration points for machine learning and LLMs. An ML classifier trained on labelled syscall data could complement the rule-based heuristics and also enable more empirical calibration of the scoring weights. LLM-based summarisation could also replace the current template-driven summary report text with more contextualised language about the sample’s behaviour.
Kubernetes orchestration. The system’s REST API and CLI interfaces are designed to support Kubernetes orchestration. This would allow the system to be deployed as a service, as well as to be integrated into existing Kubernetes workflows.
References
[1] Aqua Security. Tracee: Runtime Security and Observability Tool. https://github.com/aquasecurity/tracee. Accessed: 2026-04-04. 2024.
[2] Jan von der Assen et al. “SecBox: A Lightweight Container-based Sandbox for Dynamic Malware Analysis.” In: NOMS 2023-2023 IEEE/IFIP Network Operations and Management Symposium. 2023. doi: https://doi.org/10.1109/NOMS56928.2023.10154293.
[3] Ulrich Bayer et al. “Dynamic Analysis of Malicious Code.” In: Journal in Computer Virology 2.1 (2006). doi: https://doi.org/10.1007/s11416-006-0012-2. url: https://doi.org/10.1007/s11416-006-0012-2.
[4] Xu Chen et al. “Towards an Understanding of Anti-virtualization and Antidebugging Behavior in Modern Malware.” In: 2008. isbn: 978-1-4244-2397-2. doi: https://doi.org/10.1109/DSN.2008.4630086.
[5] Manuel Egele et al. “A Survey on Automated Dynamic Malware-Analysis Techniques and Tools.” In: ACM Computing Surveys 44.2 (2012), pp. 1–42. doi: https://doi.org/10.1145/2089125.2089126.
[6] Wes Felter et al. “An updated performance comparison of virtual machines and Linux containers.” In: 2015 IEEE International Symposium on Performance Analysis of Systems and Software (ISPASS). 2015. doi: https://doi.org/10.1109/ISPASS.2015.7095802.
[7] S. Forrest et al. “A sense of self for Unix processes.” In: Proceedings 1996 IEEE Symposium on Security and Privacy. 1996. doi: https://doi.org/10.1109/SECPRI.1996.502675.
[8] Free Software Foundation. GNU Core Utilities Manual. https://www.gnu.org/software/coreutils/manual/coreutils.html. Accessed: 2026-04-04. 2026.
[9] Google. AIP-185: API Versioning. 2024. url: https://google.aip.dev/185 (visited on 04/04/2026).
[10] Eric Hutchins, Michael Cloppert, and Rohan Amin. “Intelligence-Driven Computer Network Defense Informed by Analysis of Adversary Campaigns and Intrusion Kill Chains.” In: Leading Issues in Information Warfare & Security Research 1 (Jan. 2011).
[11] Michael Kerrisk. namespaces(7) - Linux Manual Page. https://man7.org/linux/man-pages/man7/namespaces.7.html. Accessed: 2026-04-04. 2025.
[12] Ayrat Khalimov et al. “Container-based Sandboxes for Malware Analysis: A Compromise Worth Considering.” In: Dec. 2019. isbn: 978-1-4503-6894-0. doi: https://doi.org/10.1145/3344341.3368810.
[13] Robert Lyda and James Hamrock. “Using Entropy Analysis to Find Encrypted and Packed Malware.” In: IEEE Security & Privacy 5 (Apr. 2007). doi: https://doi.org/10.1109/MSP.2007.48.
[14] Robert C. Martin. Agile Software Development: Principles, Patterns, and Practices. Prentice Hall, 2003. isbn: 978-0135974445. ®
[15] MITRE Corporation. MITRE ATT&CK : Enterprise Matrix, v18. https://attack.mitre.org/. Accessed: 2026-04-04.
[16] National Institute of Standards and Technology. Security and Privacy Controls for Information Systems and Organizations. NIST Special Publication 800-53 Rev. 5. National Institute of Standards and Technology, 2020. url: https://csrc.nist.gov/publications/detail/sp/800-53/rev-5/final.
[17] Kevin O’Reilly. CAPE: Malware Configuration and Payload Extraction. https://github.com/kevoreilly/CAPEv2. Accessed: 2026-04-04. 2019.
[18] Tasneem Salah et al. “Performance comparison between container-based and VM-based services.” In: Jan. 2017. doi: https://doi.org/10.1109/ICIN.2017.7899408.
[19] Niklas A. Schmatloch. “Design and Implementation of a Malware to Detect Containerized Sandboxing.” Supervised by Jan von der Assen and Dr. Alberto Huertas. Bachelor’s Thesis. University of Zurich, 2024. url: https://files.ifi.uzh.ch/CSG/staff/vonderassen/extern/theses/ba-schmatloch.pdf.
[20] C. E. Shannon. “A Mathematical Theory of Communication.” In: Bell System Technical Journal 27.3 (1948). doi: https://doi.org/10.1002/j.1538-7305.1948.tb01338.x. eprint: https://onlinelibrary.wiley.com/doi/pdf/10.1002/j.1538-7305.1948.tb01338.x. url: https://onlinelibrary.wiley.com/doi/abs/10.1002/j.1538-7305.1948.tb01338.x.
[21] Michael Sikorski and Andrew Honig. Practical Malware Analysis: The HandsOn Guide to Dissecting Malicious Software. No Starch Press, 2012.
[22] Murugiah Souppaya, John Morello, and Karen Scarfone. Application Container Security Guide. NIST Special Publication 800-190. National Institute of Standards and Technology, 2017. doi: https://doi.org/10.6028/NIST.SP.800-190.
[23] The chi Authors. chi: A lightweight, idiomatic and composable router for building Go HTTP services. https://github.com/go-chi/chi. Accessed: 2026-04-04. 2026.
[24] The gVisor Authors. gVisor. https://gvisor.dev/. Accessed: 2026-04-04. 2026.
[25] The gVisor Authors. gVisor Debugging. https://gvisor.dev/docs/user_guide/debugging/. Accessed: 2026-04-04. 2026.
[26] Meet Udeshi et al. “SaMOSA: Sandbox for Malware Orchestration and Side- Channel Analysis.” In: (Aug. 2025). doi: https://doi.org/10.48550/arXiv.2508.14261.
[27] Ethan G. Young et al. “The true cost of containing: a gVisor case study.” In: Proceedings of the 11th USENIX Conference on Hot Topics in Cloud Computing. USENIX Association, 2019.
[28] Tae-hyeon Yun and Moohong Min. “MITRE ATT&CK-Driven Threat Analysis for Edge-IoT Environment and a Quantitative Risk Scoring Model.” In: Computer Modeling in Engineering & Sciences 145 (Nov. 2025), pp. 2707–2731. doi: https://doi.org/10.32604/cmes.2025.072357.